Learn · Updated September 2026
Supertrend Indicator — How to Use It on a Crypto Chart
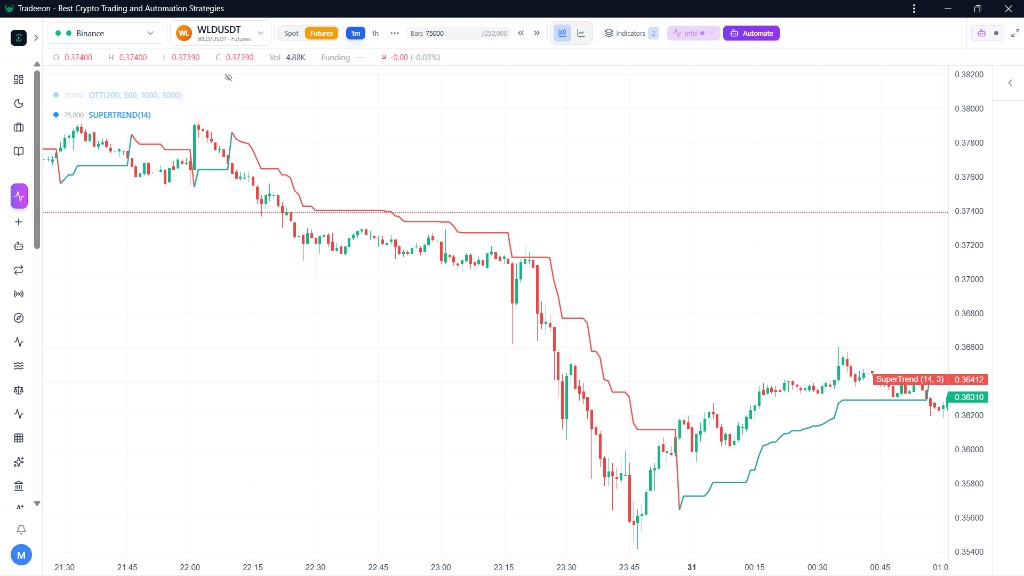
Supertrend is a trend line. Green under price means the last close was above the line. Red above price means the last close was below it. The useful skill is not the formula — it is knowing when a flip is a trend, and when it is just noise. The three shots below are the same pair on Tradeeon Studio: WLDUSDT, 1-minute, Supertrend (14, 3).
Read the line in one glance
The line is ATR × a multiplier, trailed from the bar midpoint. You do not need that to trade it. You need this: stay with the color until a candle closes through the line. A wick that tags it and fails is not a flip. 1-minute bars will flip more than a 15-minute chart — the shots here are 1m so you can see the color change clearly. Paper a higher timeframe before you automate.
When a flip holds
On this stretch Supertrend stayed red above WLD through the drop. After a close through the line it flipped green and sat under the recovery. A paper rule that only goes long after that close would have been out during the red drop and in after the flip. That is one window on one pair — not a typical return, and not a reason to go live.
Same settings, more than one flip
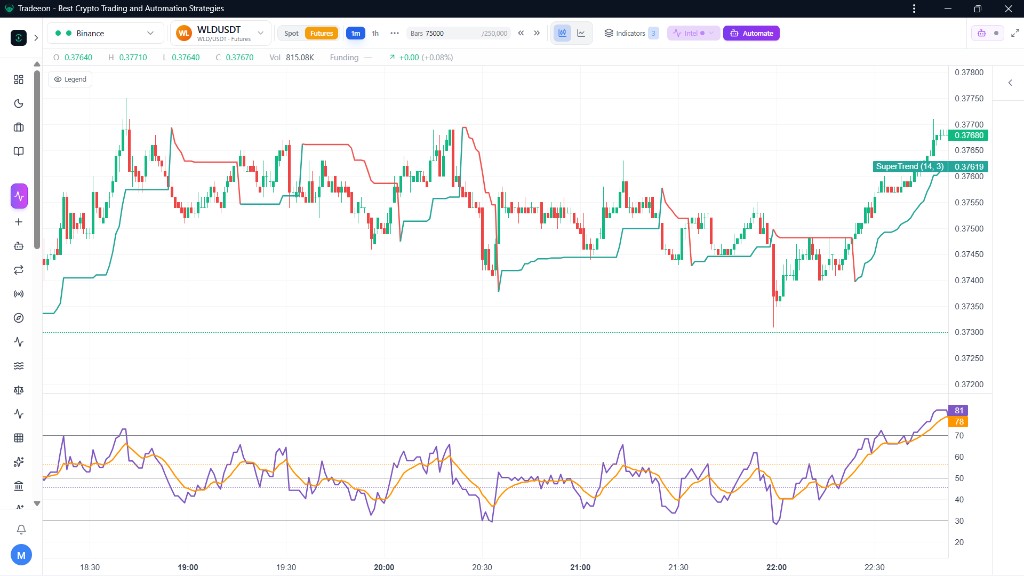
On another stretch of the same pair the line changed color in a tight range, then one later close started a short climb. If you take every color change, you trade the noise first. Supertrend is doing its job — the market just is not trending yet. That is when a second vote matters, or when you leave Supertrend alone and use a grid / DCA ladder instead.
Add RSI so you are not trading a color
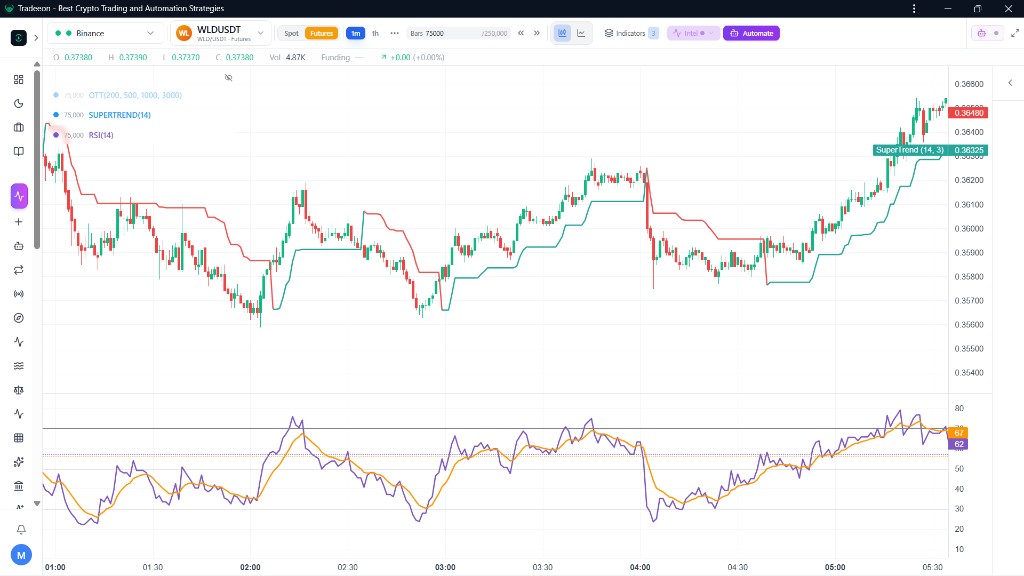
A simple paper rule already on Tradeeon: Supertrend up, and RSI coming from oversold — not Supertrend alone. On this shot the line is green under price and RSI (14) is rising with the move. That is two conditions agreeing. If RSI is already stretched when the line flips, wait. Do not chase the bar that already ran.
A rule you can paper this week
- Supertrend direction is up (green / direction = 1) on your chosen timeframe.
- RSI is not already exhausted — the usual filter is RSI below 30 first, then Supertrend confirming up (the XRP Signal template uses this on 15m).
- Enter only after the candle closes. A wick through the line is not enough.
- Exit when Supertrend flips back, or at a fixed take-profit / stop you set before the trade — not by watching the next 1m bar.
These Studio shots are a 1-minute futures tape so the flip is easy to see. A Signal bot is usually happier on 15m or 1h. Same indicator, fewer color changes.
Settings: 10, 3 vs 14, 3
TradingView and most help pages start at period 10 and multiplier 3. The charts above use 14, 3 — a slightly longer ATR window, same multiplier. Drop the multiplier if you want earlier flips (and more noise). Raise it if you want fewer trades. Change one number at a time.
Automate it without a second chart
A common path is Supertrend on TradingView → alert → another app places the order. That is two subscriptions and a webhook that can miss.
On Tradeeon, SuperTrend is a condition in the visual builder. Set it as MAIN, RSI as SUPPORTING, pick the timeframe, and run a Signal bot on paper. The charts on this page and the bot live in the same workspace. No Pine script.
Paper the rule. Do not skip to live.
A clean green stretch on WLD is a read, not a forecast. If the market is ranging, a Supertrend bot will chop. Use Pulse for a free trend check, or paper Adaptive Grid / DCA instead of forcing a trend tool.
FAQ
- What is the Supertrend indicator?
- Supertrend is a line on the chart built from ATR (volatility) and a multiplier. A close above the line is treated as uptrend; a close below as downtrend. The line flips when that happens.
- What Supertrend settings should I use?
- Most charts start at ATR period 10 and multiplier 3. The Studio shots on this page use 14 and 3 — same idea, a slightly longer lookback. Shorter / smaller = more flips. Longer / larger = fewer, later flips. Change one number, paper a week, then change the other. There is no universal best pair.
- Does Supertrend work in a ranging market?
- Poorly. In a range it flips back and forth. That is not a settings bug — the market has no trend. Add a second vote (RSI is the usual partner) or use a grid / DCA ladder instead of forcing Supertrend.
- Can I automate Supertrend without TradingView?
- Yes, on Tradeeon. SuperTrend is a condition in the visual builder. You can require RSI as supporting logic and run it as a Signal bot on paper. No Pine script and no webhook.
Related: Paper trading crypto · Binance trading bot · Pulse · Our bots
Charts are Tradeeon Studio shots of WLDUSDT, 1-minute, Supertrend (14, 3) — examples of how the line behaves, not a result and not a forecast. Not affiliated with TradingView. Not financial advice.